Introduction
The American Alpine Club annually publishes
Accidents in American Mountaineering, which contains reports from various mountaineering accidents that occurred that year. The journal also includes statistical tables which summarize the number of mountaineering accidents, injuries, and fatalities, as well as interesting specifics such as terrain, immediate and contributing causes, ages and experience levels of individuals, month of year, type of injury, and location. I was fascinated by these statistical tables, but found the data hard to visualize. So, I spent a day creating pie charts and graphs from the
2007 Statistical Tables, which contain statistics on mountaineering accidents from 1951-2006 (click the above link to see the raw data for the 2007 statistical tables, which were the most recent I could find on the AAC website). The following page gives my graphical output of the statistical tables. I also draw a few inferences from the data.
Keep in mind that statistical studies involve some degree of personal interpretation/presentation, simplification of scenarios, and biased data, so all of my deductions should be taken with a grain of salt. Also keep in mind that a percentage of mountaineering accidents are never reported. Inherent to nearly all statistical data, the "missing data" issue tends to make absolute values a bit too low, but has little effect on percentages or relative comparisons.
My overall conclusion: For your best chances at experiencing a mountaineering accident, try climbing unroped or above your abilities on rocky terrain sometime between May-Sept in California or Washington.
"To reduce the chance of an accident, competent climbers develop a balanced relationship with fear, an awareness of danger, and turn their mental energy into positive means to overcome problems. Both instinct and acquired judgement are developed from experience. One learns about choices, when to push limits, where to avoid stonefall, where to belay, and when to turn back."
"Climbing is never wholly predictable, and from this uncertainty a richness may arise. It is important not to diminish the spirit of climbing and eliminate all risk. To reduce all commitment lessens the spirit and engagement of the adventure."
-Sage advice from the climbing great Fred Beckey, Fred Beckey's 100 Favorite North American Climbs
|
1951-2006 Mountaineering Accidents, Summary Graphs
Mountaineering Accidents, Injuries, Fatalities 1951-2006:  | Injuries and Deaths per Accident, 1951-2006  |
|
Mountaineering Accident Details, 1951-2006 Averages
Primary Cause  | Contributory Cause  | Type of Injury  |
Terrain  | Ascent/Descent  | Experience Level  |
Age of Individuals  | Month  |
|
Mountaineering Accidents by Location, 1951-2006 Averages
The statistical report contains a table listing the accidents by location. I took the opportunity to plot this data on cartograms, which are a great way of plotting geographical data in a way that highlights geographical trends. The following cartograms are broken down by decade to show how the number of accidents and fatalities has evolved over the last half-century. (If you are interested in cartograms,
click here to go to my cartograms page that gives several more cool cartogram examples, as well as explains how they work, how I make them, and some background behind them.)
Some interesting trends in the pie charts and cartograms below:
- Most mountaineering accidents occur in the rugged mountainous states of Washington, California, Wyoming, Colorado, and Alaska; of these states, Washington and California have the highest number of mountain accidents. A likely reason why these states have the most mountain accidents is because they not only have the greatest area of climbable terrain, but they also have a high number of "trophy" peaks (such as Denali, Rainier, Half Dome, etc.) which attract an outsized proportion of non-locals who are often overly eager to get to the summit.
- Most mountaineering fatalities also occur in the five states mentioned above, with Washington and California having the highest numbers. In addition, Oregon also has a significant number of fatalities (even though it does not stand out as having as high a rate of accidents); these fatalities likely due to the fact that Mt. Hood seems to have a fair number of fatal accidents a year.
- When normalized by state population, most mountaineering accidents per capita occur in Wyoming and Alaska. California in particular has a much smaller accident per capita rate than total accident rate.
- When normalized by state population, most mountaineering fatalities per capita occur in Alaska and Wyoming. California in particular has a much smaller fatality per capita rate than total fatality rate.
- The highest number of accidents and fatalities occurred in the 1970s and 1980s, especially in Washington and California. This was a time when new routes were being put up and new terrain was being explored.
- Alaska has progressively had a greater percentage of the nation's mountaineering accidents and fatalities. This is likely due to an increase in Alaskan climbing as well as in increase in the proportion of accidents being better reported (although I still suspect a rather significant percentage of mountain accidents go unreported in Alaska compared to other states).
- There has been a slight increase in the proportion of accidents that occur on the Atlantic-North coast over the years. This could indicate an increase in activities such as cragging, skiing, and ice climbing.
There are surely other interesting trends I have not mentioned. So feel free to study the following pie charts and cartograms and develop some more interpretations!
Note that this data does not allow a direct conclusion that one state is safer to climb in than another. For example, are there more accidents in Colorado than Alaska because there are factors that contribute to more accidents or are there just more people climbing? (Probably the answer is there are just more people climbing since the mountains are more accessible in Colorado than Alaska.) In order to make that type of comparison the number of person-hours climbing in each state must be factored in, rather than just using the total number of accidents/fatalities.
Total Reported Accidents by Location, 1951-2006 Averages - Pie Chart
 | Fatal Accidents by Location, 1951-2006 Averages, Pie Chart
 |
|
Total Reported Accidents by Location, per 1,000,000 people in state, 1951-2006 Averages - Pie Chart
 | Fatal Accidents by Location, per 1,000,000 people in state, 1951-2006 Averages, Pie Chart
 |
|
| 1950s  |
--> | 1960s  |
--> | 1970s  |
--> |
--> | 1980s  |
--> | 1990s  |
--> | 2000s  | |
 |
| 1950s  |
--> | 1960s  |
--> | 1970s  |
--> |
--> | 1980s  |
--> | 1990s  |
--> | 2000s  |
|
 |
Comparison with Traffic Accidents, 1990-2006 data
Although not covered in the statistical tables of the American Alpine Journal's Accidents in American Mountaineering, I was interested in how the frequency of mountaineering accidents compares with the frequency of traffic accidents.
I soon discovered that it is difficult to accurately compare climbing and driving. Climbing vs. driving would be most comparable if the number of accidents could be normalized by the hours spent climbing or driving (i.e. total person-hours/year driving and total person-hours/year climbing). However, this sort of hourly data is not readily available or easily estimated (I'd estimate that I spend more time in the mountains than in my car, whereas most climbers probably drive more than climb).
So I tried another normalizing method, which involved multiplying the climbing accidents by a factor which corresponds to the fraction of climbers in the population. Assuming everyone drives, but only 1 in 150 climbs (the Outdoor Industry Association estimates there are 2 million climbers in the US, which has a population of roughly 300,000,000), then multiplying mountaineering accidents by 150 would somewhat control for exposure. Technically, this technique assumes that the typical climber spends about as many hours driving as climbing, which is probably reasonable within a factor of 2. Even when the number of climbing accidents are multiplied by the normalizing factor of 150, the statistics suggest that the act of climbing is actually safer than the act of driving by a significant margin.
My conclusion, with however large a grain of salt you want to season it with: It's more likely a climber will get in an accident driving to or from the climb than on the climb itself.
| Mountaineering | Traffic | Comments |
| Accidents reported per year | 135
(x150 = 20250)
| 6,339,200 | A climber is 313 (=6339200/20250) times more likely to get in a traffic accident than in a climbing accident. |
| Injuries per year | 111
(x150 = 16650)
| 3,031,800 | A climber is 182 (=3031800/16650) times more likely to get injured in a traffic accident than in a climbing accident. |
| Fatalities per year | 28
(x150 = 4200)
| 42,880 | A climber is 10 (=42880/4200) times more likely to die in a traffic accident than in a climbing accident.
(Note that this factor considers both accident frequency and fatality rate; hence, even though a climbing accident is more likely to cause a fatality than a traffic accident, because climbing accidents are less frequent, it is still more likely a person would die in traffic than climbing.) |
| Injuries per accident | 0.82 | 0.48 | Although mountaineering accidents are much less frequent than traffic accidents, they are 1.7 times more likely to cause injury than traffic accidents. |
Fatalities per accident
| 0.21 | 0.01 | Although mountaineering accidents are much less frequent than traffic accidents, they are 31 times more likely to cause fatalities than traffic accidents. |
Below is a bar graph (sent to me by my friend Clint Cummins) showing the main causes of death in the US in 1988 for age 15-44, by sex. Motor vehicle accidents is the biggest cause of death for males. Mountain accidents would be included under "other accidents," a category which likely includes a fair amount of non-mountaineering accidents such as falling off ladders, crashing motorboats, housefires, etc. Altogether, "other accidents" have about the same death rate as suicide, diseases, cardiovascular, and cancer.
(Random notes: In higher age groups, cardio, rather than motor vehicle accidents, dominates. This bar graph was created out of 1988 data, when the AIDS death rate was higher than it is now.)
A note on conditional risk
The previous section used statistics to show that climbing accidents are relatively rare in the grand scheme of things. However, it is still important to be aware of the very real dangers in the mountains. Conditionally, mountaineering can be a risky undertaking (for example, it would probably be much more dangerous to go climbing on loose rock in poor weather than to drive down a residential street mid-morning). But, for some people, the risk adds to the fun and adventure of climbing.
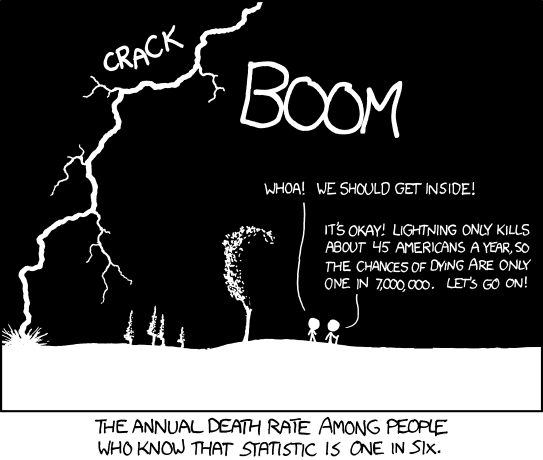
Cartoon by Randall Munroe, found on XKCD.com. |
Personal Accident Accounts
I've had the misfortune of being involved in two separate mountaineering accidents in Washington state. Both were caused by loose rock in rugged alpine terrain. In both cases, the climbing party was very experienced, and a series of good decisions resulted in a successful rescue. Click the links below to see the accident reports complete with photos.
Accident 1
In July 2009, my partner fell 60' and broke his femur and heel, requiring a
shorthaul of the north buttress of Mt. Terror. This rescue was complicated by the fact that a second uninjured person in our party was stranded on the mountain for 4 more days when poor weather prevented him being able to be airlifted off when the helicopter returned.
Accident 2
In Sept 2010—ironically, only a week after I posted this article on accident statistics—I suffered a severe
compound fracture of my tib/fib on the north face of Vesper Peak. This also required a helicopter rescue.
Mt. Rainier Climbing and Accident Statistics
I also have a separate
statistical study on Mt. Rainier data, which looks at Mt. Rainier Accident and Fatality and Search-and-Rescue statistics, among other interesting data.
More on my website
This article is copied from my website, which has several other articles, climbing trip reports, and photographs from the North Cascades and elsewhere: www.stephabegg.com.


Comments
Post a Comment